Pizza map: QGIS basics
Published September 8, 2025 NewsIn our next Maps @ MIXI meeting we’ll take a look at the basics of working with geospatial data and creating map in QGIS, a free and open-source desktop GIS application.
We’ll look at:
- installing QGIS and useful plugins
- adding basemaps
- importing data from OpenStreetMap
- editing the rows (the locations on the map) and columns (the attributes) for our data
- adding custom data fields
- exporting our map to an interactive web map using Leaflet
For my map, I’m making a guide to the pizza places near my apartment on the Prospect Heights/Crown Heights border in Brooklyn. There’s a lot we can do with just the core functionality (and no programming).
You can see the final version of the map online, here: https://data.mixi.nyc/ph-pizza-map/
Install QGIS
QGIS is a free and open-source geographic information system (GIS) that allows users to create, edit, visualize, analyze, and publish maps and other geospatial information.
Follow the instructions https://qgis.org/download/ to install it for your platform. It works on Linux, Mac, and Windows.
Install/enable QuickMapServices to choose a basemap
The QuickMapServices plugin provides a lot of different “basemaps”. These let you see and add on top of OpenStreetMap, Google Maps, satellite images, and the very useful CartoDB basemaps.
1. Install QuickMapServices
- In QGIS:
Plugins → Manage and Install Plugins…- Search QuickMapServices → Install.
- On some platforms, it may already be installed by default.
- After install:
Web → QuickMapServices → Settings → More services → Get contributed pack.
2. Add Basemaps
Follow these instructions to add a basemap later ro your project. You can add more than one and toggle them on/off as needed in the Layers panel (left side).
- Go to
Web → QuickMapServices → [Provider]. - Common options:
- Carto → Positron (Light), Dark Matter (Dark)
- Google → Satellite, Hybrid, Roads, Labels
- OSM → Standard, Humanitarian
- ESRI → World Imagery, Topographic
Import OSM Points into QGIS using QuickOSM
1. Install the Plugin
- Go to Plugins → Manage and Install Plugins…
- Search for QuickOSM and click Install.
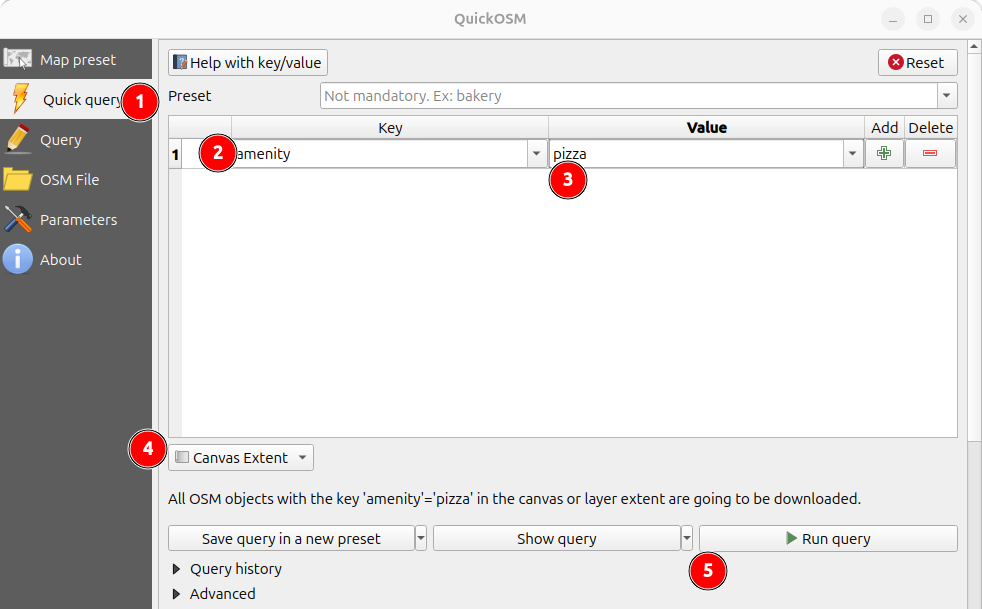
2. Open QuickOSM
- In the QGIS menu, go to Vector → QuickOSM → QuickOSM…
3. Build Your Query
- Choose “Quick Query” in the left panel
- Key:
amenity - Value:
pizza(or restaurant, school, etc.) - In: select
Canvas Extent, this searches the active area of the open map. Zoom/pan to change the search area before running the query. - Click Run Query
4. Explore the Results
- If any results were found, you will have a new layer on your map
- The point layer will appear in the Layers Panel (named something like
amenity_pizza) - Right-click the layer and choose Show Labels to see the names of the places
(If nothing shows up, you may have to adjust the label settings in the Layer Properties → Labels to choosename.)
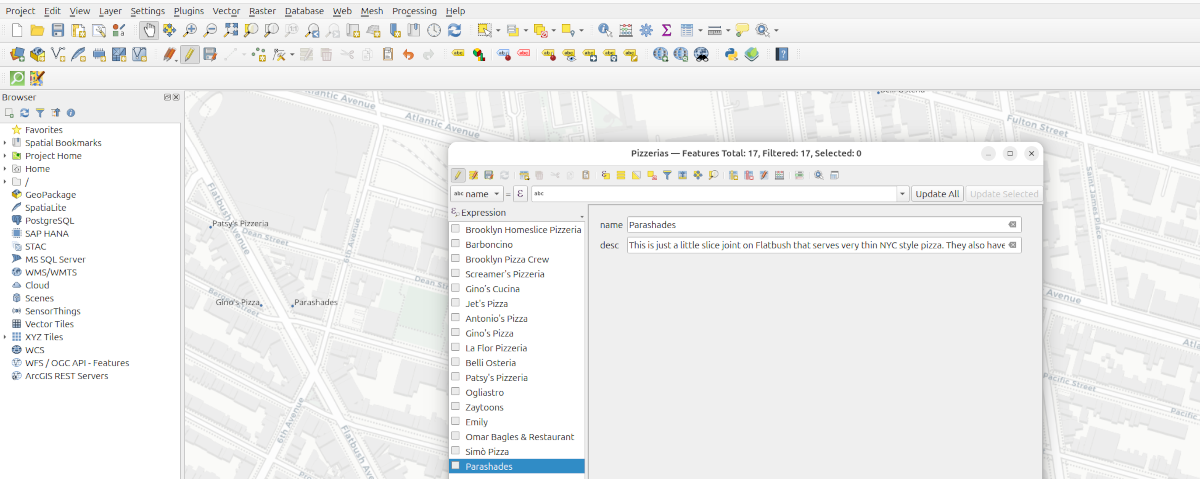
Working with Attribute Data in QGIS
We imported all of the data about our “amenities” that was available from OpenStreetMap. This includes all kinds of stuff (street address, website, open hours, etc). It also includes several “ID” fields. For our simple web map, we just want a name and a description of the place. We can delete all of the other fields except for name.
We can edit the data table to delete any places we don’t want to include in our map. Once we have just the points we need, we can edit the names and add our own descriptions.
1. Open the Attribute Table
- Right-click a vector layer → Open Attribute Table.
- This shows all the fields (columns) and records (rows).
2. Delete Unwanted Fields
- In the attribute table, click the Pencil icon (Toggle Editing Mode).
- Click the Delete Field button (trash can icon).
- Select the fields (columns) you don’t need → OK. Don’t delete
fid– QGIS needs it. - Save edits (disk icon) and turn off editing.
3. Add a New Field
- Attribute table → Toggle Editing Mode.
- Click the New Field button (plus icon).
- Choose:
- Name: field name (e.g.,
description). - Type: Text, Integer, Decimal, Date, etc.
- Length / Precision if needed.
- Name: field name (e.g.,
- Click OK → the new field is added as a column.
4. Edit Attributes
- Edit cell values:
- Toggle editing → click into a cell → type a new value.
- Delete rows (features):
- Select one or more rows.
- Click the Delete Selected Features button.
- Edit feature properties:
- Use the Identify Features tool on the map → edit values in the form popup.
5. Save Changes
- After editing fields or rows, always click Save Edits (disk icon).
- Then toggle off editing mode to finish.
Export QGIS Maps to HTML/Leaflet with qgis2web
This plugin allows you to export your QGIS project as an interactive web map using Leaflet. Leaflet is one of the most popular JavaScript libraries for programming and publishing interactive maps. Your map will probably work fine if you just choose “Leaflet” and choose export.
1. Install qgis2web
- In QGIS:
Plugins → Manage and Install Plugins… - Search for qgis2web → Install.
2. Configure Layers
- Style each layer (fill, outline, labels) the way you want it to appear.
- Enable/disable labels in the Layer Properties → Labels tab.
3. Export
- Go to:
Web → qgis2web → Create web map… - Choose Leaflet.
- Check these tabs:
- Layers and Groups → select which layers to include (I chose Positron for the base layer, and Pizzeria for the point data).
- Fields → choose which fields to include in the popups (I chose
nameanddesc). Markfidas hidden. - Appearance → popups, tooltips, zoom/scale controls.
- Export → pick an output folder.
- Settings → use EPSG:4326 for web.
- Click Export.
4. Result
- A folder is created with:
index.html(your map)- Leaflet JS + CSS
- Your data as GeoJSON
- You should be able to open
index.htmlby double clicking it. Otherwise, open your browser (Chrome, Firefox, Safari, etc) and File → Open File → selectindex.html. - Eventually we can host published maps on the mixi website or on GitHub Pages.
Make it better
Obviously this tutorial doesn’t cover everything. With a little more work you can:
- add a title and description to your map (very easy!)
- add custom points that aren’t in OSM (maybe using Google or Bing basemaps to help find them)
- run custom queries in QuickOSM to search by name or other field
- add a color guide to distinguish different types of places
- add icons instead of simple dots as map markers
- add HTML styled text and photos the popups
- embed your leaflet in a web page with other content